The effect of light intensity on the amount of chlorophyll in “Cicer arietinum”
As the aim of this project is to investigate the dependence of mass of chlorophyll in plants during different light intensities it was needed to create those various conditions. Pots with seeds were placed into the following places: in the wardrobe with doors (light intensity is o lux), under the sink (light intensity is 20,5 lux), in the shell of bookcase (light intensity is 27,5 lux), above the bookcase (light intensity is 89,5 lux), above the extractor (light intensity is 142 lux), beyond the curtains (light intensity is 680 lux) and on the open sun (light intensity is 1220 lux). Light intensity was measured with the help of digital luxmeter. It was measured four times each day: morning, midday, afternoon, evening. During those four periods four measurements were done and the maximum value was taken into consideration and written down. Those measurements lasted for three weeks of the experiment as the whole time of the experiment was three weeks. The luxmeter’s sensitive part was placed on the plants (so it was just lying on them) in order to measure light intensity flowing directly on plant bodies, then two minutes were left in order to get stabilized value of light intensity and the same procedure was repeated. All those actions were done in order to get more accurate results of light intensity.
Growing plants were provided with the same amount of water (15 ml, once a day in the morning) and they were situated in the same room temperature (20o C), pH of soil was definitely the same because all the plants were put in the same soil (special soil for room flowers).
After three weeks past the length of plants was measured with the help of ruler. Firstly the plants were not cut, so their length had to be measured while they were in the pots. The ruler was placed into the pot and plants were carefully stretched on it. The action was repeated three times and only maximum value was taken into consideration. After that plants were cut. Then those already cut plants were put into the dark place and quickly dried.
Titration.
I have chosen three plants from each light intensity group and measured their weight. . In order to obtain the pigments, three plants were cut into small pieces and placed in a mortar. Calcium carbonate was then added, together with a little ethanol (2 cm3). The leaf was grinded using a pestle until no large pieces of leaf tissue were left, and the remaining ethanol was poured into the mortar (3 cm3). Then 1 ml of obtained solution was placed into the test tube and this 1 ml of solution was then titrated against 0.01 M solution of sulfuric acid, through the use of a pipette. The titration was complete when the green solution turned dark olive-green4. This solution obtained from the first action was stored as the etalon for the following ones. The settled olive-green coloring meant that all chlorophyll had reacted with H2SO4. So the process of titration was repeated 7 times for all light intensity groups.
The solution is titrated until the dark olive-green color because it is known that when the reaction between chlorophyll and sulfuric acid happens, chlorophyll turns into phaeophetin which has grey color (see table 1), therefore when the solution is olive-green, than the reaction has succeeded. But while searching in the internet and books I found out that there are several opinions about the color of phaeophytin – in the book written by Viktorov it is ssaid to have grey color, but in the internet link ch.ic.ac.uk/local/projects/steer/chloro.htm it is said to have brown olive-green color. Also I made chromatography in order to investigate the color of phaeophytin and the result was that it has grey color. It can be proposed that olive-green color is obtained because grey phaeophetyn is mixed with other plant pigments.
So titration is one of the visual methods that can be used in order to find the mass of chlorophyll in plants.
All the measurements and even chromatography were done three times and the mean value was taken, for chromatography grey color was confirmed.
Table 1. Plant pigments.
|
Name of the pigment |
Color of the pigment |
|
Chlorophylls ( a and b ) |
Green |
| Carotene |
Orange |
| Xanitophyll |
Yellow |
|
Phaeophytin-a |
OLIVE BROUN or GREY |
IV. Results.
Table 2. Raw data.
|
Number of plant |
Light intensity (lux) |
||||||
|
0,0 |
20,5 |
27,5 |
89,5 |
142,0 |
680,0 |
1220,0 |
|
|
1 |
23 |
35 |
20 |
1 |
30 |
2 |
15 |
|
2 |
30 |
36 |
33 |
4 |
31 |
20 |
16 |
|
3 |
38 |
37 |
35 |
8 |
34 |
21 |
16 |
|
4 |
39 |
37 |
36 |
9 |
35 |
21 |
16 |
|
5 |
44 |
38 |
37 |
9 |
38 |
21 |
17 |
|
6 |
46 |
39 |
40 |
12 |
38 |
22 |
17 |
|
7 |
50 |
39 |
40 |
12 |
38 |
22 |
19 |
|
8 |
52 |
40 |
43 |
13 |
39 |
23 |
20 |
|
9 |
55 |
40 |
43 |
15 |
39 |
25 |
21 |
|
10 |
40 |
18 |
40 |
27 |
22 |
||
|
11 |
42 |
20 |
41 |
29 |
26 |
||
|
12 |
42 |
22 |
41 |
30 |
|||
|
13 |
42 |
22 |
41 |
31 |
|||
|
14 |
42 |
24 |
42 |
33 |
|||
|
15 |
43 |
25 |
42 |
34 |
|||
|
16 |
43 |
25 |
43 |
34 |
|||
|
17 |
44 |
25 |
43 |
35 |
|||
|
18 |
44 |
25 |
43 |
35 |
|||
|
19 |
45 |
26 |
45 |
37 |
|||
|
20 |
45 |
26 |
45 |
38 |
|||
|
21 |
45 |
26 |
46 |
38 |
|||
|
22 |
45 |
26 |
46 |
41 |
|||
|
23 |
46 |
27 |
48 |
41 |
|||
|
24 |
46 |
29 |
48 |
44 |
|||
|
25 |
49 |
32 |
49 |
||||
|
26 |
34 |
49 |
|||||
|
Mean |
41,888889 |
41,76 |
36,33333 |
19,80769 |
41,30769 |
29,33333 |
18,63636 |
|
Median |
44 |
42 |
37 |
23 |
41,5 |
30,5 |
17 |
|
St. deviation |
10,50529 |
2,928 |
4,740741 |
7,467456 |
4 |
7,472222 |
2,694215 |
Table 3. Frequency of lengths of 3-weeks-old plants depending on light intensity.
|
Light intensity, lux |
|||||||
|
Plant length, cm (class) |
0,0 |
20,5 |
27,5 |
89,5 |
142,0 |
680,0 |
1220,0 |
|
0.0-10.0 |
0 |
0 |
0 |
5 |
0 |
1 |
0 |
|
10.1-20.0 |
0 |
0 |
1 |
6 |
0 |
1 |
8 |
|
20.1-30.0 |
2 |
0 |
0 |
13 |
1 |
10 |
3 |
|
30.1-40.0 |
2 |
9 |
6 |
2 |
9 |
9 |
0 |
|
40.1-50.0 |
3 |
15 |
2 |
0 |
16 |
3 |
0 |
|
50.1-60.0 |
2 |
0 |
0 |
0 |
0 |
0 |
0 |
|
Total |
9 |
24 |
9 |
26 |
26 |
24 |
11 |
Table 3 (alternative) Frequency of length of 3-weeks-old plants depending on light intensity.
|
Light intensity, lux |
|||||||
|
Plant length (Class) |
0,0 |
20,5 |
27,5 |
89,5 |
142,0 |
680,0 |
1220,0 |
|
0.0-10.0 |
0 |
0 |
0 |
19,23% |
0 |
4,17% |
0 |
|
10.1-20.0 |
0 |
0 |
11,10% |
23,08% |
0 |
4,17% |
72,72% |
|
20.1-30.0 |
0 |
0 |
0 |
50% |
3,85% |
41,62% |
27,28% |
|
30.1-40.0 |
0 |
37,50% |
66,60% |
7,69% |
34,62% |
37,52% |
0 |
|
40.1-50.0 |
0 |
62,50% |
22,30% |
0 |
61,53% |
12,52% |
0 |
|
50.1-60.0 |
100% |
0 |
0 |
0 |
0 |
0 |
0 |
|
Total |
1 |
1 |
1 |
1 |
1 |
1 |
1 |
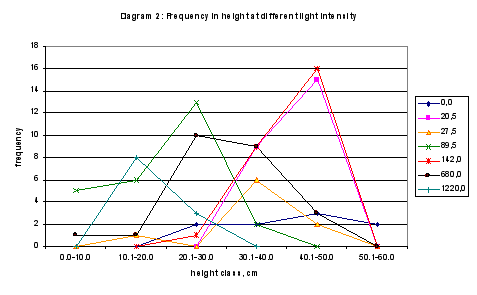
Calculation of the mean length of plants.
For light intensity equal to 20,50 lux:
The sum of lengths of all plants in this group is 45cm + 37cm + 39cm + 49cm + 46cm + 44cm + 45cm + 44cm + 42cm + 37cm + 40cm + 40cm + 39cm + 43cm + 42cm + 42cm + 36cm + 45cm + 38cm + 45cm + 46cm + 40cm + 35cm + 42cm + 43cm = 1044cm
Hence mean length is 1044cm : 25 plants = 41,76cm
Table 4.
|
Light intensity, lux |
Mean wet biomass, g |
Mean dry biomass, g |
% of water |
Mean length, cm |
Mass of chl. In 1 g |
|
0 |
0,273 |
0,041 |
84,98 |
41,89 |
0,0000 |
|
20,5 |
0,579 |
0,056 |
90,33 |
41,76 |
0,0496 |
|
27,5 |
0,332 |
0,033 |
90,06 |
36,33 |
0,1462 |
|
89,5 |
0,181 |
0,018 |
90,06 |
19,81 |
0,1769 |
|
142 |
0,511 |
0,047 |
90,80 |
41,33 |
0,0697 |
|
680 |
0,338 |
0,043 |
87,28 |
29,33 |
0,1557 |
|
1220 |
0,301 |
0,034 |
88,70 |
18,64 |
0,1939 |
Calculation of amount of chlorophyll in plants basing on the results of titration
H2 SO4 + C56 O5 N4 Mg => C56 O5 N4 H + MgSO4
Concentration of H2SO4 is 0,01 M
C – concentration
V – volume
n – quantity of substancy
m – mass
Mr – molar mass
For light intensity equal to 20,5 lux.
n = V (in dm3) ∙ C
2 ∙ 10-3 ∙ 0,01 = 2 ∙ 10-5
n = m / Mr => m = n ∙ Mr
m = 2 ∙ 10-5 ∙ 832 = 1,664 ∙ 10-2 grams
mass of plant mass of chlorophyll
1,68 grams - 0,08335 grams of chlorophyll
1 gram - x grams of chlorophyll
Hence there are 0,0496 grams of chlorophyll.
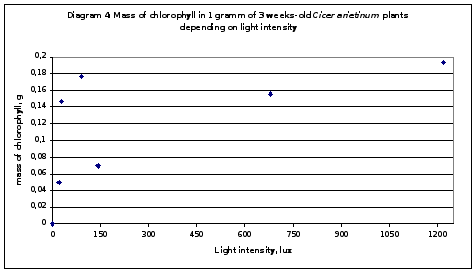
Table 5. The correlation between mean length of plants and mean dry biomass.
|
Site |
Mean length, cm |
Rank (R1) |
Mean dry biomass, g |
Rank (R2) |
D (R1-R2) |
D2 |
|
|
1 |
41,89 |
1 |
0,041 |
4 |
-3 |
9 |
|
|
2 |
41,76 |
2 |
0,056 |
1 |
1 |
1 |
|
|
3 |
36,33 |
4 |
0,033 |
6 |
-2 |
4 |
|
|
4 |
19,81 |
6 |
0,018 |
7 |
-1 |
1 |
|
|
5 |
41,33 |
3 |
0,047 |
2 |
1 |
1 |
|
|
6 |
29,33 |
5 |
0,043 |
3 |
2 |
4 |
|
|
7 |
18,64 |
7 |
0,034 |
5 |
2 |
4 |
|
|
Rs = 0,57 |
|||||||
|
critical value = 0,79 |
|||||||
0,57<0,79, therefore there is no significant correlation between mean length of plants and mean dry biomass.
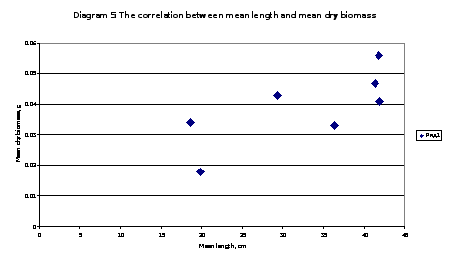
Table 6. The correlation between mean length and mass of chlorophyll per 1 g of plant.
|
Site |
Mean length, cm |
Rank (R1) |
Mass of chl. In 1 g |
Rank (R2) |
D (R1-R2) |
D^2 |
|
|
1 |
41,89 |
1 |
0,0000 |
7 |
-6 |
36 |
|
|
2 |
41,76 |
2 |
0,0496 |
6 |
-4 |
16 |
|
|
3 |
36,33 |
4 |
0,1462 |
4 |
0 |
0 |
|
|
4 |
19,81 |
6 |
0,1769 |
2 |
4 |
16 |
|
|
5 |
41,33 |
3 |
0,0697 |
5 |
-2 |
4 |
|
|
6 |
29,33 |
5 |
0,1557 |
3 |
2 |
4 |
|
|
7 |
18,64 |
7 |
0,1939 |
1 |
6 |
36 |
|
|
|||||||
There is negative correlation between mean length of plants and mass of chlorophyll per 1 g of plant
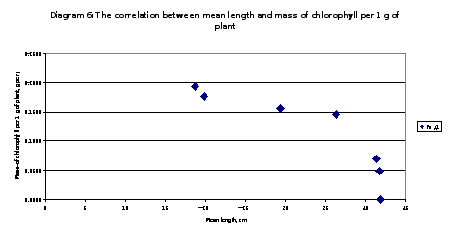
Table 7. The correlation between mean dry biomass and mass of chlorophyll per 1 g of plant.
|
Site |
Mean dry biomass, g |
Rank (R1) |
Mass of chl. In 1 g |
Rank (R2) |
D (R1-R2) |
D^2 |
|
|
1 |
0,041 |
4 |
0,0000 |
7 |
-3 |
9 |
|
|
2 |
0,056 |
1 |
0,0496 |
6 |
-5 |
25 |
|
|
3 |
0,033 |
6 |
0,1462 |
4 |
2 |
4 |
|
|
4 |
0,018 |
7 |
0,1769 |
2 |
5 |
25 |
|
|
5 |
0,047 |
2 |
0,0697 |
5 |
-3 |
9 |
|
|
6 |
0,043 |
3 |
0,1557 |
3 |
0 |
0 |
|
|
7 |
0,034 |
5 |
0,1939 |
1 |
4 |
16 |
|
|
Rs = -0,57 |
|||||||
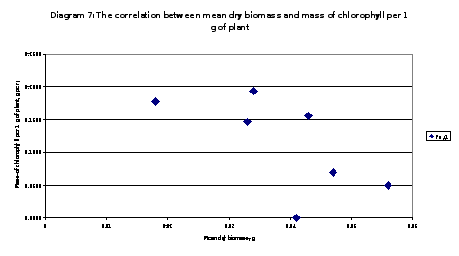
0,57<0,79, therefore there is no significant correlation between mean dry biomass and mass of chlorophyll per 1 g of plant
V. Discussion.
Several tendencies can be clearly seen.
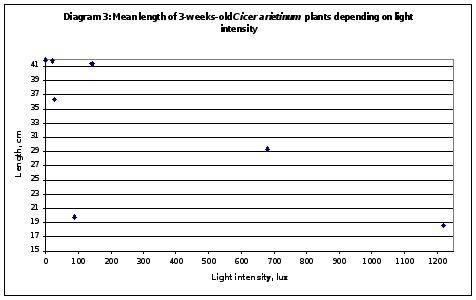
For the first, with the increase of light intensity mean length of plants is decreasing, but there are exceptions. For light intensity 142 lux the value of mean length is approximately equal to the values of length for light intensities 0 lux and 20,5 lux. If exclude this data it is also seen that for light intensity equal to 680 lux mean length is also slightly falling out from the main tendency – decreasing from 19.81 cm.
The second tendency is increase of mass of chlorophyll per 1 gram of plant biomass with the increase of light intensity. But the values of mass of chlorophyll of those plants under light intensities 142 lux and 680 lux are falling out from the main tendency. The first and the second ones are too small – approximately equal to the value corresponding to 20.5 lux light intensity and to 89.5 lux respectively. This may happen because not all the seeds of Cicer arietnum were of the same quality, because it is impossible to guarantee that more than 250 seeds in one box have the same high quality. At the mean time it was expected that starting from the light intensity more than 680 lux the amount of chlorophyll in plants will decrease, because the value of destructed chlorophyll with be bigger than the value of newly formatted. But the experiments showed that the amount of chlorophyll was constantly increasing even when the light intensity level exceeded the point 1220 lux. This could happen because light intensity equal to 1220 lux is not so extremely high that the amount of total chlorophyll in plants will start decreasing.
Also it is clearly seen that there are no correlations between light intensity and values of wet and dry biomass.
Basing on these arguments the sudden decrease of the amount of chlorophyll in plants placed on light intensity equal to 142 lux was likely to be insignificant and could not be considered as a trend.
But it is impossible to forget such important factor as plant hormones that affect the growth and development of plants. There are five generally accepted types of hormones that influence plant growth and development. They are: auxin, cytokinin, gibberellins, abscic acid, and ethylene. It is not one hormone that directly influences by sheer quantity. The balance and ratios of hormones present is what helps to influence plant reactions. The hormonal balance possibly regulates enzymatic reactions in the plant by amplifying them.
VI. Conclusion.
Due to results of my investigation it is seen that my hypothesis didn’t confirm fully (for example, comparing the diagram 1 and diagram 7), because I proposed that when light intensities will be very high, mass of chlorophyll in plant will start decreasing and due to my observations it didn’t happen. I should say that the only reason I can suggest is that I haven’t investigated such extremely high light intensities, so that chlorophyll start destructing. But if we will not pay attention to that fact the other part of my hypothesis was confirmed and mass of chlorophyll in plants increased with the increase of light intensity. Furthermore I didn’t estimate amount of plant hormones and so didn’t estimate their influence on results.
Questions for further investigation:
Investigating very high light intensities.
Implementation of colorimetric analysis.
Paying attention to estimation of plant hormones level.
Those questions should be further investigated in order to get clearer picture and more accurate results of the dependence of the amount of chlorophyll in plants on the light intensity, knowing the fact that the amount of chlorophyll has a tendency to decrease at extremely high light intensities. So this statement needs an experimental confirmation and as in this investigation conditions with extremely light intensity were not created in further investigations they have to be created.
Implementation of colorimetric analysis is also very important thing, because it gives much more accurate results comparing with the titration method. The colorimetric method suggests that as different pigments absorb different parts of light spectrum differently, the absorbance of a pigments mixture is a sum of individual absorption spectra. Therefore the quantity of each individual pigment in a mixture can be calculated using absorbance of the certain colors and molecular coefficients of each pigment. This was proposed by D. A. Sims, and J. A. Gamon (California State University, USA)5 with the reference on Lichtenthaler (1987).
VII. Evaluation.
There are several results in my work, that are falling out from the main tendencies. It may seem that such results may occur due to different percentage of water in plants, but when I was calculating mass of chlorophyll in 1 gram of plant I was using only values of mean dry biomass so it couldn’t affect my results. (see table 3)
At the same time such differences in the percentage of water are easily explained. The rate of evaporation of water from plants, which were put under 1220 lux light intensity was much higher than of those put