Supply and demand
For our example, we will think of a subsidy for the production of corn. (Some countries have paid subsidies for the production of grain in order to make food cheaper for poor people). Let us suppose the government pays corn farmers a dollar per bushel of corn, in addition to whatever price they get in the marketplace. Figure 11 shows the supply and demand for corn. A subsidy per unit of production works pretty much like an excise tax, except in reverse. In particular, we can look at the change from the point of view either of buyers or sellers. In this example, we will look at the subsidy from the point of view of the buyers. From their point of view, the subsidy is an increase in supply.
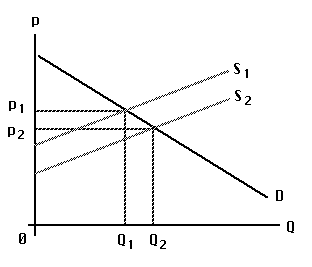
A Subsidy
Accordingly, the figure shows the subsidy shifting the supply curve to the right, from S1 to S2. The vertical distance is the amount of the subsidy: one dollar per bushel. Demand is D, as usual. With supply S1 -- before the subsidy is given -- the market equilibrium price is p1 and the equilibrium production is Q1. With supply S2 -- when the subsidy is given -- the market equilibrium price is p2 and the equilibrium production is Q2. We may conclude that a subsidy per unit of production reduces the market price (though not quite by the full amount of the subsidy) and increases the production of the item subsidized.
Conclusion
How are we to understand the market for a good such as beer, potatos, or cheese? Common sense can tell us that the supply, demand, price and quantity produced are interdependent, but how do they depend on one another? The most general and important answer to that question in modern economics is encapsulated in the "Supply and Demand" model.
We have defined "demand" as a relation between the price of the good and the quantity consumers want to buy. Similarly, we have defined "supply" as the relation between the price and the quantity that producers want to sell. When we put these two concepts together, we identify the market "equilibrium" with the price and quantity at the intersection of the demand and supply relations -- that is, a price just high enough that quantity demanded is equal to quantity supplied, and the quantity corresponding to that price.
In a wide variety of historic and current examples, we find that we can explain changes in quantities and prices as the equilibria of supply and demand, with shifts in demand or in supply causing changes in price and quantity. The changes in price and quantity are coordinated in ways that can be understood and predicted, if we understand the theory of supply and demand.
Literature
AP APO System Administration by Liane Will. Principles for effective APO system Management. SAP press. 2007.
Lisa Knight, Meadow Glade Elementary, Battle Ground, WA. Supply and demand. 2004.
McConnel C.R., Brue S.L. Economics: Principles, Problems and Policies.-14 th ed.-Boston etc. : Irwin: McGraw-Hill, 1998.
Samuelson P. A., Nordhaus W. D. Economics.- 16 th ed.-Boston etc.: Irwin: McGraw-Hill, 2005.
Slavin S.L. Economics: a Self-Teaching Guide. - New York etc.: Wiley, 1988.
Walstad W. B., Bingham R. C. Study Guide to accompany McConnell and Brue Economics. - 14 th ed. - Boston etc.: McGraw-Hill, 2003.