Private sector and human-resource development in Georgia
For the purchase of a real estate legally (notary) approved document and purchaser’s registration in general list is required. The application for registration could be submitted by the seller or purchaser as well.
The right of ownership on agricultural and as well as non-agricultural lands is granted only to citizens of Georgia and to private legal entities registered according to Georgian legislation.
The fee for getting legal (notary) approval on real estate transactions is different in each case and depends on the value of real estate. The fee decreases with the increase of property value and fluctuates within 3-0,05%. The fee should not exceed GEL 10 000.
Transfer of real estate, except new dwelling constructions (new constructions are defined to be dwelling constructions built up within 2 years period) are free from VAT. Tax for transfer of immovable thing makes up 2% of property value.
For the registration of right on ownership on land-lot and related real estate and issue of relevant registration notice, the state registration fee makes up GEL 26.
The Business Environment in Georgia
Investors face a difficult environment in Georgia starting with the fundamental issue of geopolitical instability. In addition, several surveys of existing and potential domestic and foreign investors show that the business environment is generally perceived as bureaucratic, non-transparent and corrupt. Georgia is perceived as having significant obstacles to investment in the areas of taxes and regulations, policy instability/uncertainty and corruption. While the average official and unofficial fees for business procedures and the resources required (staff and time spent) may not be the highest in comparison to other countries, the unpredictability of costs and delays related to administrative procedures combined with uneven implementation and enforcement of regulations increases business risk and results in differential treatment among firms.
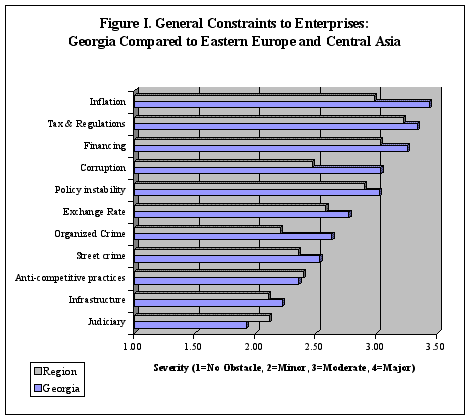
As shown in the above Figure, when scores on general constraints to business operations for enterprises in Georgia are compared to regional averages, the constraints are shown to be worse in Georgia for every category except the performance of the judiciary and anti-competitive practices. This substantiates the earlier observation that the business environment is perceived as being much more constrained in Georgia compared to competitors in the region. Further, it emphasizes the need for the Government of Georgia to address these critical constraints in order to help improve the country’s attractiveness for domestic and international investors.
Time and again it has been observed that decrees and programs of reform have been adopted but weakly implemented in the absence of the strong political will necessary to effect change. For example, the State Customs Department (SCD) reform committee was established by Presidential Order to finalize a reform strategy and implement an action plan. To date, little has been done on implementation. The committee rarely meets. Reform has been impeded by competing agendas and frequent changes in SCD leadership due to absence of strong political will to reform the customs department.
Corrupt practices significantly affect the process of doing business in Georgia by increasing the cost and the risk associated with a range of administrative procedures. From the perspective of foreign investors in particular, facilitation payments or bribes do not simply increase business costs. They constitute significant risk because in Georgia they are unpredictable and uneven. Also, in all OECD countries bribery constitutes a serious legal offence that can be prosecuted in the home country. Finally, corrupt taxation administration (income tax evasion) and customs procedures (smuggling) result in unfair competition for legitimate, law-abiding enterprises.
In addition, the following fundamental issues have the impact on administrative procedures in Georgia, particularly in the areas of customs and tax administration, licensing, and inspections:
Inconsistent implementation of legislation and lack of transparent implementing regulations and procedures. Since 1991, a number of laws have been revised and new laws have been written and promulgated. Although these laws are generally modern and well written, poor implementation and enforcement effectively undermine the intent of the laws. Throughout this report, it is clear that the legal framework and official requirements for most administrative procedures are relatively sound. However, problems and inconsistencies arise in implementation as officials often seek to maintain and exercise discretionary authority and control of administrative procedures.
Lack of published information on the various administrative procedures required for business establishment and operation. For example, the official gazette is significantly behind schedule and the business stamp approval procedure is still issued by the police at the cost of 10 GEL. The challenge of publishing and disseminating timely and current information among officials and the public is even greater because of the ongoing changes to existing laws. However, timely publication and dissemination is necessary in order to minimize information gaps and opportunities for corruption.
Absence of effective mechanisms for holding public officials accountable. In principle, the Administrative Code and the Civil Code include provisions on the conduct and accountability of public officials. However, in practice these provisions are not enforced. Efforts to introduce and implement codes of conduct for taxation and customs officials have had limited effect to date.
Absence of effective appeals mechanisms and the inadequate capacity of the courts. The Administrative Code provides for the public’s right to be heard in protesting or seeking clarification on the actions of most government agencies. However, there is no provision for an independent or autonomous arbiter to provide recourse. This function is apparently to be carried out by the courts. However, the integrity of the courts is often suspected and the capacity of the courts to address these issues is limited.
Institutional Arrangements
Securities Industry
The institutional structure of the securities industry includes the following market participants: reporting companies (i.e. the private companies whose shares are traded at Georgian Stock Exchange), securities brokerage companies, share registrars, clearing banks, Georgian Central Securities Depository (GCSD) and Georgian Stock Exchange (GSE). The overall supervision is carried out by the National Securities Commission of Georgia (NSCG). The rights of the securities market participants are protected by the Georgian Securities Industry Association (GSIA). The structure of Georgian Stock Market is presented in Fig. 1.3.1.1:

Fig. 1.3.1.1. The Structure of Georgian Stock Market
Society
Poverty issues
Poverty Trends. The relatively slow rebound from the economic collapse after independence has led to a severe decline in welfare. Georgia’s annual income per capita is about 56 percent below the pre-independence level, unemployment rates are high (16 percent in 2001) and many Georgians are underemployed. In the circumstances, poverty, vulnerability and inequality have all increased over the period. Georgia clearly needs to achieve and sustain higher economic growth rates to improve living conditions. Given the small size of the domestic market, this can be achieved only through a stronger expansion in export activities, especially of those in which Georgia has a comparative advantage and the potential to generate new job opportunities, such as agro-processing.
Poverty Profile. Strengthened economic performance resulted in an reduction of poverty in the mid 1990s. However, Georgia’s growth rate slowed considerably between 1998 and 2000, and consequently inequality and poverty increased as measured by any of several methodologies increased (see Table 2.1.1). Growth was affected by a number of shocks, including the 1998 Russian crisis, severe droughts in 1998 and 2000, and the increase in the price of energy imports in 2000. These problems were compounded by internal and external political instability. Growth recovered in 2001-02, leading to a slight reduction in overall poverty.
Table 2.1.1. Change in poverty in Georgia between 1997 and 2002
| Poverty Headcount (% of population) | ||||||
| Poverty definitions (lines) | 1997 | 1998 | 1999 | 2000 | 2001 |
2002a/ |
|
Official minimum |
46.6 |
50.5 |
53.0 |
52.5 |
52.0 |
51.3b/ |
|
Urban |
46.7 |
53.3 |
60.4 |
56.6 |
54.3 |
53.7 |
|
Rural |
46.4 |
47.1 |
44.6 |
48.0 |
49.6 |
48.8 |
|
US$4.30 per capita/day at PPPc/ |
13.6 | 19.8 | 23.2 | 23.0 | 22.8 | 21.7 |
|
Recommended poverty line (baseline) |
13.6 |
19.8 |
23.2 |
23.0 |
22.8 |
21.7 |
|
Urban |
13.8 |
22.2 |
27.4 |
24.6 |
24.1 |
22.6 |
|
Rural |
13.4 |
16.8 |
18.4 |
21.4 |
21.3 |
20.7 |
|
US$2.15 per capita/day at PPP c/ |
9.7 | 11.8 | 14.5 | 15.4 | 14.8 | 13.5 |
|
US$1.075 per capita/day at PPP c/ |
1.7 | 3.0 | 3.2 | 3.3 | 3.4 | 2.7 |
|
Source: SDS SGHH primary data and World Bank, see Georgia Poverty Update, Report No. 22350-GE. Note: Theofficial poverty line uses a normative basket and CPI price data to cost it and is around 100 GEL (about US$50 at current exchange rate) per equivalent adult per month. The recommended poverty line was developed jointly by the World Bank and SDS in 1998; it uses actual consumption patterns of the population and survey prices (its non-food component is fixed in real terms to 1996 and deflated using the CPI for non-food items); it is about 55 GEL (US$25) per month per equivalent adult. The equivalence scale used in the official and recommended methodology is the scale developed by SDS and used in Georgia to determine the social assistance payments. International poverty lines expressed in dollar terms (US$ in PPP) are per capita and use the latest (1996) revision of the World Bank, updated with the Georgia CPI. All figures are averages of quarterly data. a/ Preliminary estimate; corrections for changes in the Survey not made. b/ Bank estimates using official methodology. c/ Using 0.33 as PPP conversion factor. |
||||||
Differential Impact of Rising Poverty. IDA, in close collaboration with the State Department of Statistics, prepared a Poverty Update covering the 1998-2000 period. The study found that the increase in poverty affected various socioeconomic groups differently, with growing differentiation among the poor, and signs that the poorest became even poorer. Poverty depth and severity increased in the observed period by 84 and 94 percent respectively. Driven by the volatile economic environment and absence of an adequate safety net, vulnerability to poverty for the average household rose significantly, with female-headed households being the most vulnerable. Although the extent of absolute poverty at any point in time remained around 20-24 percent, 40 percent of the population experienced poverty at least once during the year 1999-2000, and 60 percent of the population faced a real risk of experiencing poverty in the medium term. The high degree of vulnerability of households led them to apply strategies which may tend to increase chronic (long-term) poverty (e.g., shifting to subsistence farming, or pulling children out of school).
Urban and Rural Poverty. The trend in overall poverty reflects somewhat different developments in urban and rural poverty. In 1997, rural and urban poverty incidence were almost the same. In 1999, the urban poverty headcount doubled in comparison to 1997, whilst the rural headcount increased by 37.3 percent. Then in 2000, responding to the non-agricultural sector recovery after the Russian crisis, urban poverty dropped by 10.2 percent, stabilized in 2001 and declined further by 6.2 percent in 2002. Because of the drought, rural poverty increased in 2000, remained unchanged in 2001 and only in 2002 decreased by 2.9 percent. As a result, the difference between the urban and rural headcount has narrowed -- while in 1999, the urban poverty headcount was almost 50 percent over that in the rural population, in 2002 it was 9 percent higher.
Determinants of Poverty. The Georgia Poverty Update identified that the strongest determinants of poverty risk in Georgia in the period between 1998 and 2000 were economic: employment status, sector of employment, ownership of productive assets and education. It found an elevated poverty risk among urban households, households with an unemployed head and female headed households, as well as children aged 7-15, the disabled, those with low levels of education, single pensioners and orphans were experiencing. The working poor are becoming the majority, often employed in the informal sector with insecure, temporary and low productivity jobs.
Non-Income Indicators of Poverty. Non-income indicators of poverty in Georgia, inherited from Soviet times, still compare favorably with those of countries with similar per capita income. The UNDP 2003 Human Development Report ranks Georgia 88th among 175 nations. However, Georgia faces a major challenge in sustaining these relatively favorable indicators. Studies conducted by various international organizations (UNICEF, USAID, EC, etc.), indicate that there has been no improvement in the indicators during the 1990s. In fact, maternal mortality rate, immunization rates, access to health and education, access to safe water and sanitation and other living conditions indicators have deteriorated and the quality of social services has worsened substantially in comparison to the pre-transition situation.
Internally Displaced People. IDPs vulnerability to poverty is magnified by their lack of access to land. Thus IDPs living in collective centers are 3Ѕ times less likely to have access to land than the local population, and those living in private accommodations half as likely. In addition, IDP’s rate of unemployment is very high -- 40% among IDPs living in collective centers. Government benefits do seem, however, to be reaching the IDPs, with 80% to 90% receiving a government benefit.
Millennium Development Goals. The estimates of Georgia’s prospects for achieving the Millennium Development Goals (MDGs) show a mixed picture based on Georgia’s current performance, as indicated in Table 2.1.2.
Table 2.1.2: Millennium Development Goals
|
Millennium Development Goal |
Present Situation |
Prospects for Achievement by 2015 |
|
Goal 1: Eradicate extreme poverty and hunger. Target 1: Halve, between 1990 and 2015, the proportion of people whose income is less than $2.15 a day. NOTE: While the MDG indicator and target include $1 Если Вам нужна помощь с академической работой (курсовая, контрольная, диплом, реферат и т.д.),
обратитесь к нашим специалистам. Более 90000 специалистов готовы Вам помочь.
Бесплатные корректировки и доработки. Бесплатная оценка стоимости работы.
Нужна помощь в написании работы?
Мы - биржа профессиональных авторов (преподавателей и доцентов вузов). Пишем статьи РИНЦ, ВАК, Scopus.
Помогаем в публикации. Правки вносим бесплатно.
Похожие рефераты: |