Private sector and human-resource development in Georgia
At independence in 1991, the country had 64,500 hectares of state-owned tea plantations. Civil war, decline in demand from former markets in the FSU and the loss of state financing have caused much of the area formerly planted to tea to be abandoned. As of January 2002, 37,296 hectares of agriculture land were planted to tea. Tea plantations now occupy 65 percent of Guria’s total agricultural land, 27 percent of Samegrelo’s total agricultural land, 58 percent of Ajara’s total agricultural land and 6 percent of Imereti’s total agricultural land (Table 1). Following the abolition of collective agriculture, land under tea plantations has mostly been privatized in Guria, while in Samegrelo, Ajara, and Imereti most of the tea plantations have been leased out.
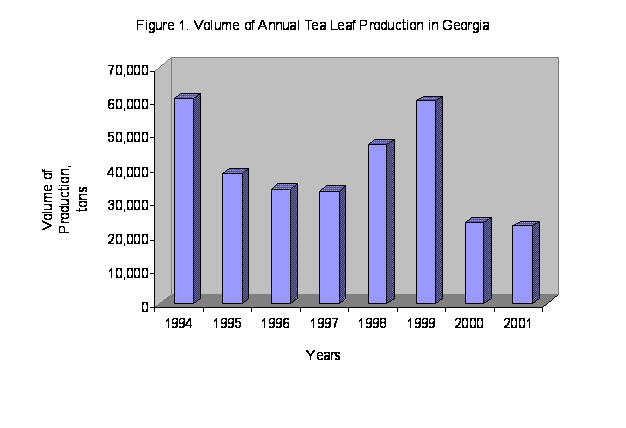
Tea leaf production data in the early 1990s is extremely unreliable and so not reported here. It is clear that production levels have fallen greatly from those of the late 1980s. Production has generally continued to drift downward since the mid-1990s (Tables 2-3, Figures 1-2).
According to the Ministry of Agriculture and Food, as of January 1, 2001 there were 146 tea processing enterprises in Georgia (including Abkhazeti) with a total annual capacity of 722,800 tons. There were 50 tea factories in Samegrelo, 30 in Guria, 16 in Imereti, and 18 in Ajara. Forty-six of the 50 enterprises in Samegrelo had been privatized, while 30, 11 and 1 enterprises had been privatized in Guria, Imereti, and Ajara, respectively. These enterprises mostly use worn-out, obsolete equipment and are in poor financial condition. Some of these enterprises are reported to have vertically integrated operations, while others operate on a contractual basis with tea growers. As might be expected, almost all tea grown appears to be sold to the factories so that the processing trends follow those of production (Table 4, Figure 3). The nature of tea also means that the producers are much more dependent on the processors than are, say, owners of vineyards. Homemade wine is a reasonable and widely practiced option for primary producers; homemade tea is not.
During 1994-2001 Georgia was a net exporter of tea, although it also was a substantial importer and the balance of trade appears to be turning against Georgia (Table 5, Figure 4). In the early and mid 1990s the major importers of Georgian tea were in the FSU, but since 1997 geographic coverage has widened as processors developed new markets. Exports of Georgia tea to US, Germany, and Poland show an increase (Table 6).
Tea remains an important cash crop among rural households in most of West Georgia. The share of households in total tealeaf production in 1999 was 43 percent, in 2000, 34 percent, and 93 percent in 2001 (Table 7).
Table 1. Land under Tea Plantations, 2001
|
Region |
District |
Total |
Total
Area under ha |
Area
of Tea |
Area
of Usable ha |
Percent
of Plantations |
Share
of the |
Area
of Land |
|
Ajara |
Regional Total |
9590 |
5,518 |
1,674 |
3,844 |
30% |
1.70 |
58 |
|
Samegrelo |
Zugdidi |
10,169 |
5,061 |
654 |
4,407 |
13% |
1.80 |
50 |
|
Martvili |
9,334 |
2,721 |
330 |
2,391 |
12% |
1.65 |
29 |
|
|
Senaki |
9,699 |
1,202 |
324 |
878 |
27% |
1.72 |
12 |
|
|
Chkhorotsku |
4,830 |
2,492 |
463 |
2,029 |
19% |
0.86 |
52 |
|
|
Tsalenjikha |
3,886 |
2,993 |
0 |
2,993 |
0% |
0.69 |
77 |
|
|
Abasha |
9,654 |
67 |
67 |
0 |
100% |
1.71 |
1 |
|
|
Khobi |
10,340 |
1,438 |
0 |
1,438 |
0% |
1.83 |
14 |
|
|
Regional Total |
58524 |
15974 |
1838 |
14136 |
12 |
10.37 |
27 |
|
|
Guria |
Ozurgeti |
5,501 |
7,358 |
890 |
6,468 |
12% |
0.97 |
|
|
Lanchkhuti |
7,864 |
1,988 |
445 |
1,543 |
22% |
1.39 |
25 |
|
|
Chokhatauri |
3,720 |
1,786 |
518 |
1,268 |
29% |
0.66 |
48 |
|
|
Regional Total |
17085 |
15,974 |
1,838 |
14,136 |
12% |
3.03 |
65 |
|
|
Imereti |
Tskaltubo |
12,025 |
1,141 |
385 |
756 |
34% |
2.13 |
9 |
|
Tkibuli |
3,811 |
1,073 |
200 |
873 |
19% |
0.68 |
28 |
|
|
Chiatura |
7,323 |
246 |
38 |
208 |
15% |
1.30 |
3 |
|
|
Vani |
5,335 |
130 |
70 |
60 |
54% |
0.95 |
2 |
|
|
Zestafoni |
6,127 |
38 |
0 |
38 |
0% |
1.09 |
1 |
|
|
Terjola |
7,741 |
120 |
39 |
81 |
33% |
1.37 |
2 |
|
|
Samtredia |
8,103 |
380 |
0 |
380 |
0% |
1.44 |
5 |
|
|
Khoni |
6,971 |
1,544 |
790 |
754 |
51% |
1.23 |
22 |
|
|
Regional Total |
73065 |
11,132 |
1,853 |
9,279 |
17% |
12.94 |
6 |
|
|
Georgia, Excluding Abkhazeti |
TOTAL |
564,518 |
37,296 |
6,887 |
30,409 |
18% |
28% |
7 |
Source: State Department of Statistics of Georgia, author's estimates. The data for Ozurgeti clearly contain an error.
Table 2. Annual Tea Leaf Production in Georgia, 1985-2001
(tons)
-
1985
581,200
1990
501,700
1994
60,700
1995
38,500
1996
34,000
1997
33,200
1998
47,200
1999
60,330
2000
23,999
2001
23,000
Source: State Department of Statistics of Georgia
Table 3. Tea Leaf Production by Regions, tons
|
Ajara |
Imereti |
Samegrelo |
Guria |
Georgia |
|
|
1999 |
7,326 |
6,693 |
28,791 |
17,520 |
60,330 |
|
2000 |
2,914 |
2,662 |
11,453 |
6,970 |
23,999 |
|
2001 |
1,924 |
1,050 |
12,518 |
7,508 |
23,000 |
Source: State Department of Statistics of Georgia, author's estimates
 Table
4. Tea Processing, 1994-2001
(tons)
|
1994 |
1995 |
1996 |
1997 |
1998 |
1999 |
2000 |
2001 |
|
|
First Stage Processing, Including |
13,424.3 |
7,992.0 |
8,895.7 |
9,158.5 |
9,988.9 |
12,897.8 |
4,793.1 |
4,478.6 |
|
Black Baikhi |
6,732.0 |
5,804.7 |
6,152.6 |
8,360.7 |
11,789.8 |
4,361.9 |
4,219.4 |
|
|
Green Baikhi |
1,260.0 |
3,091.0 |
3,005.9 |
1,628.2 |
1,108.0 |
431.2 |
259.2 |
|
|
Natural Tea, Including |
4,473.3 |
4,230.0 |
3,747.4 |
7,759.2 |
4,871.0 |
4,509.0 |
3,014.7 |
3,765.1 |
|
Packed |
4,003.9 |
1,997.2 |
2,796.2 |
6,420.0 |
2,955.7 |
2,648.4 |
1,904.8 |
2,695.5 |
|
Green Break |
469.4 |
2,232.8 |
951.2 |
1,339.2 |
1,915.3 |
1,860.6 |
1,109.9 |
1,069.6 |
|
Granulated Tea |
144.0 |
890.1 |
605.3 |
474.1 |
658.7 |
|||
|
Liquid Tea |
39.0 |
58.0 |
||||||
|
Total |
17,897.6 |
12,222.0 |
12,643.1 |
17,061.7 |
15,750.0 |
18,012.1 |
8,320.9 |
8,960.4 |
Source: State Department of Statistics
Table 5. Georgia’s Tea Trade
|
Imports, USD |
Exports, USD |
Coverage Ratio, % |
|
|
1994 |
12439 |
11555495 |
929.0 |
|
1995 |
157876 |
8380262 |
53.1 |
|
1996 |
151898 |
16814164 |
110.7 |
|
1997 |
292190 |
13872490 |
47.5 |
|
1998 |
434761 |
8918643 |
20.5 |
|
1999 |
380428 |
11394714 |
30.0 |
|
2000 |
536702 |
6084280 |
11.3 |
|
2001 |
544454 |
5792750 |
10.6 |
Source: State Department of Statistics, author’s estimates
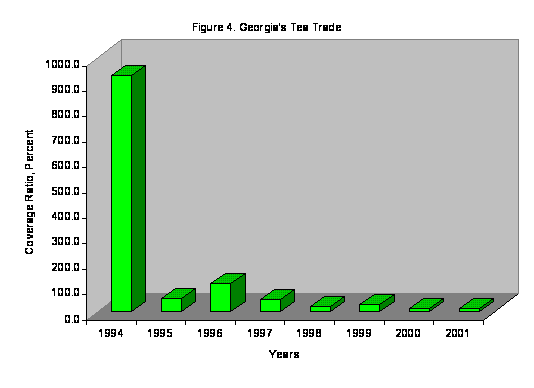
Table 6. Top 10 Export Destinations of Georgian Tea, 1994-2001
|
1994 |
1995 |
1996 |
1997 |
1998 |
1999 |
2000 |
2001 |
|
|
1 |
RUS |
TKM |
TKM |
RUS |
RUS |
RUS |
RUS |
RUS |
|
2 |
UKR |
RUS |
RUS |
UZB |
UZB |
UKR |
UKR |
POL |
|
3 |
BLR |
UKR |
UZB |
TKM |
DEU |
DEU |
DEU |
USA |
|
4 |
TKM |
KGZ |
TJK |
TJK |
TJK |
TKM |
USA |
DEU |
|
5 |
UZB |
KAZ |
UKR |
MNG |
SYR |
USA |
MNG |
UKR |
|
6 |
TJK |
UZB |
KAZ |
UKR |
NLD |
UZB |
UZB |
MNG |
|
7 |
KAZ |
TJK |
MNG |
POL |
MNG |
MNG |
POL |
UZB |
|
8 |
TUR |
MNG |
AZE |
KAZ |
BLR |
TJK |
UKR |
TKM |
|
9 |
MDA |
BLR |
BLR |
BLR |
UKR |
BLR |
KAZ |
IDN |
|
10 |
POL |
MDA |
KGZ |
KEN |
KAZ |
POL |
TKM |
TJK |
Source: State Department of Statistics, author’s estimates
Table7. Household Contribution to Total Production
All of Georgia excluding Abkhazia
|
1999 |
2000 |
2001 |
|
|
Production by Households, tons |
25,942 |
8,160 |
21,390 |
|
Total Production, tons |
60,330 |
23,999 |
23,000 |
|
Household Share in Total Production, percent |
0.43% |
0.34% |
0.93% |
Source: State Department of Statistics, author's estimates
Trade
|
Georgian Foreign Trade Statistics. In 2002 Georgian foreign trade turnover (registered) totalled US$1045,0 million, that is 104,6 % of previous year's data for the appropriate period. From this export is US$325,0 million (101,5% accordingly) and import -US $720,0 million (106,1%). Negative trade balance of Georgian trade for 2002 stood at US$395,0 million.
|
Number of Countries Foreign Trade Balance - US$ million Negative trade balance Year 2001 88 378,8 Year 2002 89 454,2 Positive trade balance Year 2001 30 20,1 Year 2002 40 59,2 All trade partners Year 2001 118 358,7 Year 2002 129 395,0 |
|
Georgian
Foreign Trade: 2001-2002 (in US$ millions) |
Construction
Overview of Georgian Construction Sector. Georgian construction sector mainly consists of civil, industrial, hydro-technical, transport, and communication construction projects.
The construction sector was established long before the formation of the country as a legal state and has passed from primitive buildings to complicated and sophisticated complexes. Throughout various stages of the country’s development, buildings and other construction projects reflect the period in which they were built. For nearly the last two centuries Georgia was part of the Russian empire and the Soviet Union, thus, the development of the construction sector was in accordance with the laws and conditions accepted by Russia and the FSU, i.e. massive construction of industrial facilities. During that period the construction sector employed almost 250,000 people and produced construction materials worth approximately US$1.5 million annually.
After the collapse of the Soviet Union, the Georgian construction sector ceased development, which was mainly caused by the political, social and economic conditions of the country (i.e. a coup, civil war, and armed conflicts in Abkhazia and South Osetia), and also by non-efficient, highly energy consuming technologies and outdated equipment and machinery. As a result, almost one hundred percent of the construction factories and facilities ceased functioning.
During the early ‘90s, when Georgia became independent and positioned itself towards democracy and integration into the world economy, the Georgian construction sector realized that it was totally unprepared to meet the demands and standards of country’s development phase. The main negative aspects characterizing such non-preparedness were:
Non-efficient and partially destroyed equipment and machinery.
Lack of investment in majority spheres of construction (except private construction).
Weak management of the sector from the government’s side.
Lack of professional managers and specialists with knowledge of international principles.
Great need of specialized trainings for the staff.
Harsh economic condition of scientific, projecting and architecture institutions.
Import of foreign construction materials and workforce.
Among other important factors, considering the importance and crucial character of the construction industry for the country’s economic development, the Georgian government made several positive steps towards rehabilitation of the construction industry to create a favourable investment environment including passing the law on promotion and guarantee of foreign investment activities, and instituting a process of restructuring and privatisation. A few years ago the government of Georgia launched a process of restructuring and privatisation of large Soviet era construction enterprises. As a result, various non-efficient, illiquid and monster enterprises have changed their organizational structure and been converted into small cost and energy efficient, liquid plants. Derived from the privatisation process the majority of state construction companies have become private joint stock and limited liability companies. In addition, a huge number of uncompleted construction sites have been privatised and completed.
Main Indicators of Development in the Construction Sector. The slight revival and positive trends in the construction sector have been noticed since 1995 – the period when the Georgian national currency the Lari (GEL) was introduced.
The table below indicates the main financial flow in the construction sector during 1995-2002 (first nine months).
|
Year |
Monetary unit |
Investment in main capital |
Government investment |
Construction and engineering work |
Personal funds of population* |
Foreign investment |
|
1990 |
Million Rubles |
2545 |
2233 |
1313 |
93 |
- |
|
1991 |
2698 |
2435 |
1882 |
140 |
- |
|
|
1992 |
12368 |
11521 |
8636 |
532 |
- |
|
|
1993 |
Billion Coupon |
311 |
142 |
270 |
168 |
- |
|
1994 |
55821 |
30769 |
41758 |
25000 |
- |
|
|
1995 |
Million Lari |
127 |
65 |
90 |
19 |
43 |
|
1996 |
170 |
60 |
91 |
24 |
86 |
|
|
1997 |
266 |
67 |
114 |
19 |
180 |
|
|
1998 |
512 |
915 |
244 |
16 |
401 |
|
|
1999 |
364 |
119 |
248 |
76 |
169 |
|
|
2000 |
349 |
141 |
181 |
89 |
119 |
|
|
2001 |
362 |
201 |
101 |
33 |
128 |
|
|
2002 |
246 |
158 |
86 |
59 |
29 |
Source: Ministry of Construction and Urbanization
* The construction of dwellings in Georgia is mainly based on up-front deposits made by people who will live there after the construction is completed.
According to the table investments in main capital from 1995-2002 constitutes 2396 million Georgian Lari (1109 million USD) which includes: Government investment – 906 million GEL (419 million USD) – 37.8%, personal funds of the population – 335 million GEL (155 million USD) – 14.0%, foreign investment – 1155 million GEL (534 million USD) – (48.2%). Derived from this data we can state that investment in main capital shows a trend toward a positive increase (+2.7) from 1995-2001 compared to 1995. In addition, the increase in foreign investment is quite noticeable. This was mainly due to the construction of the oil pipeline and Supsa oil terminal in 1998.
In 2002 the positive developments in the construction sector continue to accelerate, resulting in construction of 545 buildings, among theses are the construction of a new Marriott hotel, 62 stores, 38 gas stations, and 12 food outlets (all in Tbilisi).
Market demand (Construction Materials). Even though several local construction material manufacturing plants have been restructured and rehabilitated, the goods manufactured by them do not have a high demand among Georgian customers. Mainly this is due to low quality and narrow assortment. The only Georgian made product of comparatively good quality is cement, produced by the Rustavcement and Kaspicement companies. This situation represents a good opportunity for U.S. firms to invest in and/or upgrade local building materials manufacturing plants. Presently, product imported from Turkey, Dubai, Iran and Russia occupies almost 95% of the Georgian building materials market. Even though they are perceived to be of a lower quality, the majority of people still buy them because of the low price. Nevertheless, another Georgian customer segment, the high income family, still prefers building materials made in the U.S. or Europe, due to the high quality and regardless of the higher price.
The following imported materials are in the highest demand on the Georgian market:
Ceramic Products (tile, mats)
Insulated American style windows, doors.
Various colored wood and flooring materials.
Heat, ventilation, air conditioning systems.
Roofing materials
Varnish paints
Plastic tubes for water communication
Wallpapers
Lights and bulbs
Vinyl sidings
Due to the growing wave of construction, a large market share still remains unoccupied and is ready for new companies and potential investors. The construction sector will play an essential and important role in Georgia’s further economic development and integration into the world economy.
Business
Company Registration and Licensing System
Company Registration System
Enterprise register. Registration of an enterprise is to be carried out by the Court by making due records in the Enterprise Register. The information concerning the registration is to be recorded into the Register Card. The Register Card specimens are presented below:
Registration card (sample) for Limited Liability Companies (LLC)
|
Ser. No. |
Date |
Subject of activity and aggregate capital of the society |
Name, date and place of birth, occupation, address of partners |
Name, date and place of birth, occupation, address of directors |
Name, date and place of birth, occupation of members of the supervisory council (if any) |
Representation of directors |
Trade representatives (procurators) |
Registration card (sample) for Joint Stock Companies (JSC)
|
Ser. No. |
Date |
Subject of activity and capital |
Tapes of shares; sharing |
Name, date and place of birth, occupation, address of directors |
Name, date and place of birth, occupation address of members of the supervisory council |
Representation of directors |
Trade representatives (procurators) |
The Law on Entrepreneurs provides that data on newly registered companies should be published in the official newspaper. The Law also guarantees information on any company entered into the enterprise register held by courts be available to the public. Any person should be able to view the records and obtain extracts from the registration file.
Procedure for registering (establishing) an enterprise. Figure 4.1.1.1 provides an outline of the sequence of the procedures to register and establish a business