Private sector and human-resource development in Georgia
Target 2: Halve between 1990 and 2015, the proportion of people who suffer from hunger.
In 2002, the poverty incidence at the international poverty line of US$2.15 per capita/per month at PPP was 13.5 percent.
While the exact percentage of people suffering from hunger in Georgia is not known, there is no evidence that would indicate that hunger is an issue in Georgia.
Likely. The Economic Development and Poverty Reduction Program of Georgia envisages economic performance that would allow Georgia to meet the MDG.
Goal 2: Achieve universal primary education.
Target 3: Ensure that by 2015, children everywhere, boys and girls alike, will be able to complete a full course of primary schooling.
Enrollment rates in basic education (grades 1-9) are close to 100 percent.
Likely.
Goal 3: Promote gender equality and empower women.
Target 4: Eliminate gender disparity in primary and secondary education, preferably by 2005 and in all levels of education no later than 2015.
Surveys show no significant gender differences in access to primary and secondary education.
Likely.
Goal 4: Reduce child mortality.
Target 5: Reduce by two-thirds, between 1990 and 2015, the under-five mortality rate.
According to the Human Development Report 2003, the under-five morality rate in Georgia in 2001 was 29 per 1,000 live births. This was better that the average for ECA (36/1,000); and much better than the average for medium human development group of countries – 61 per 1,000 live births.
Due to current efforts and actions planned under the EDPRP to keep immunization rates at high level, improve breast-feeding rates, provide appropriate case management and home and in community for acute respiratory infection, pneumonia and diarrhea and improve access to appropriate health care, reliable water and improved sanitation, it is estimated that Georgia will make a significant progress in reducing the U5MR. However, the MDG target (U5MR of 9.7 per 1,000 live births, which is close to the current U5MR level in developed countries) is estimated as unlikely to be met, given Georgia’s very low public spending on health.
Goal 5: Improve maternal health.
Target 6: Reduce by three-quarters, between 1990 and 2015, the maternal mortality ratio.
Available data suggests the MMR doubled over the last 10 years to almost 59 per 100,000 live births in 2001. Only 59 percent of women complete the mandatory 4 antenatal visits but 96% of births are attended by skilled health personnel
Planned actions aimed at improving antenatal care are expected to result in decreased maternal mortality. However, given high maternal mortality rate and its recent increase, the MDG target (15 per 100,000 live births) is estimated as unlikely to be met.
|
Millennium Development Goal |
Present Situation |
Prospects for Achievement by 2015 |
|
Goal 6: Combat HIV/AIDS, malaria and other diseases. Target 7: Have halted by 2015 and begun to reverse the spread of HIV/AIDS. Target 8: Have halted by 2015, and begun to reverse, the incidence of malaria and other major diseases. |
HIV/AID is spreading fast. The number of new HIV cases in 1997 increased nearly threefold compared with the previous year and accounted 21 cases; in 2001 93 cases were registered. From 1998 through 2001 more then a half of newly registered HIV cases have been attributed to IDUs. The percentage of new cases attributed to heterosexual contacts also increases, suggesting that the epidemic is leaking into the general population. HIV/AIDS is predominantly present in young people (21-35 years old). In 2001 over 87 percent of all new AIDS cases have been detected in 26-35 age group. The prevalence of TB has increased from 28.2 in 1991 to 85.8 in 2001, reflecting the spread of disease, but also better recording of incidence. |
While Georgia has improved HIV recording and reporting, there is an urgent need to introduce prevention & education on a broad basis, as well as surveillance among high risk groups. The MDG target for HIV/AIDS is unlikely to be met Political commitment and additional resources are required to keep the spread of TB under control. An upcoming PHC Development program is expected to further improve the effectiveness of control measures. If measures are appropriately implemented, it is possible to arrest and reverse the trend. |
|
Goal 7: Ensure environmental sustainability. Target 9: Integrate the principles of sustainable development into country policies and programs and reverse the loss of environmental resources. Target 10: Halve by 2015 the proportion of people without sustainable access to safe drinking water. |
The National Environmental Action Plan and Biodiversity Strategy are a framework for environment and sustainable use of natural resources. The EDPRP highlights steps to mainstream environment into development, but implementation is limited. An environmental permitting system and other legislation are in place, but institutional weaknesses (unclear responsibilities, weak monitoring and enforcement, sometimes excessive and non-transparent regulations) limit enforcement. With regard the specific indicators, despite its unique ecosystems in Georgia 2.8% of the land area is protected to maintain biological diversity compared with the world average of 6.5%. Forest cover is 40% but the quality of management is inadequate. Energy intensity and carbon emissions indicators are not high, but there are severe problems with delivery of energy services to the population. In 1999, about 86% of urban population and 43% of rural population had access to piped water supply. Reliability and quality of services are serious problems. Water systems are largely in a state of severe disrepair. Low capacity of people to pay for the services together with limited government budgets represent real constraints to mobilize resources into the sector. Involvement of IFIs is critical to avoid total collapse of sector. |
Political will and strong commitment as well as human and financial resources are needed to ensure environmental sustainability. If the governance environment and institutional capacity improve, and if resources for environment and natural resource management could be increased, it would be possible to meet target 9. About US$ 8-10 million annually will be needed for the rehabilitation of old deteriorated existing systems and expansion of access to piped water supply to an additional 0.5 million people if the target 10 were to be met. Given current low level of investments in the sector, it is unlikely that Georgia will meet this target. |
Economics
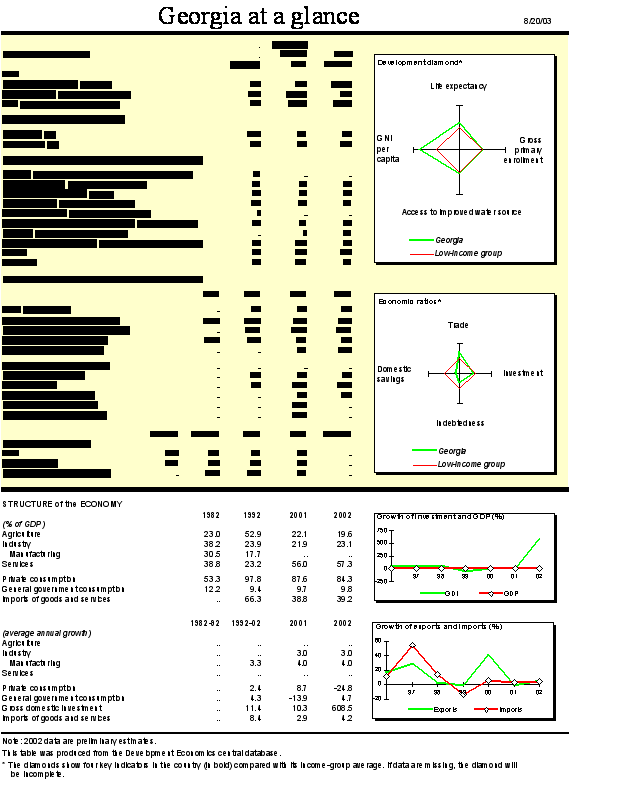
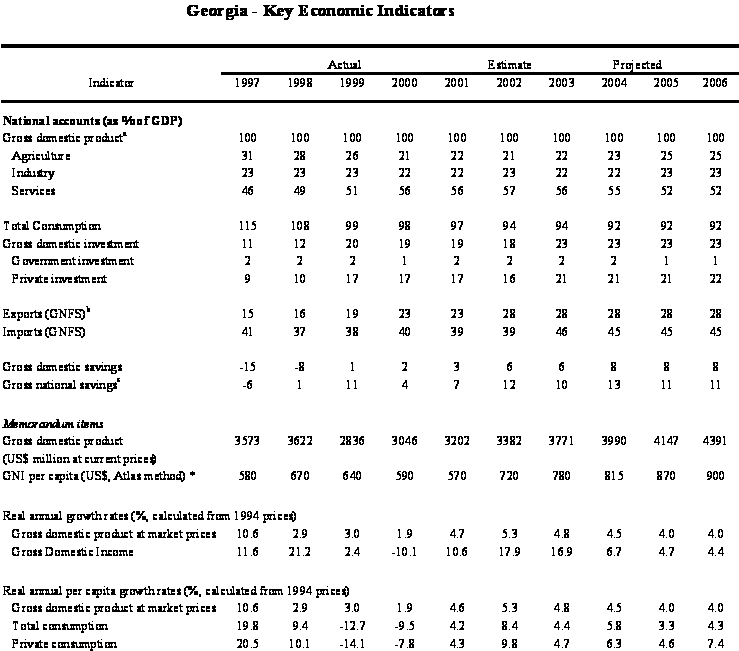
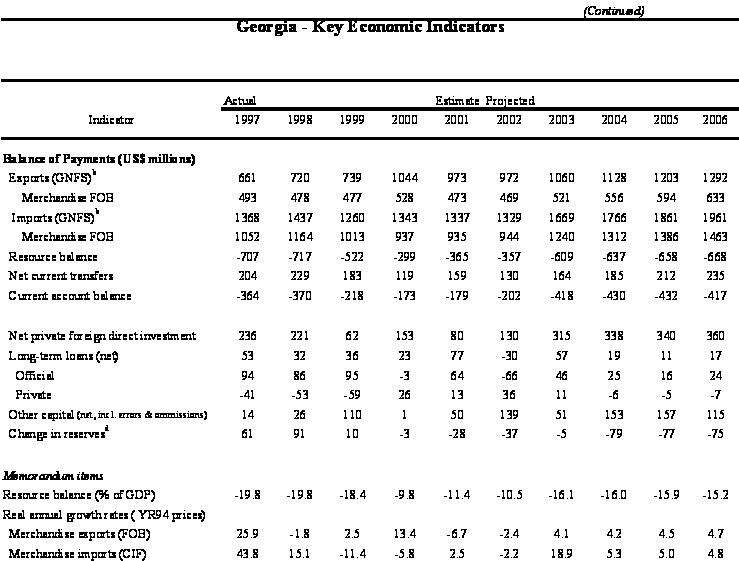
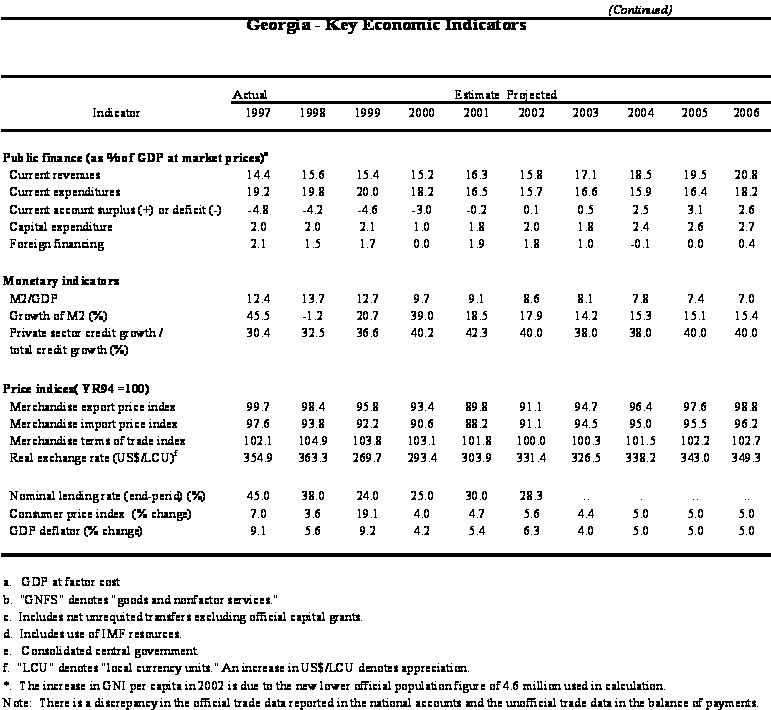
Main economic indicators
Sectoral
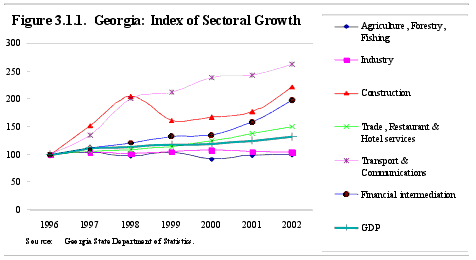
Growth. Agriculture, industry, trade and transport dominate the
structure of the Georgian economy. Agriculture is the largest
sector accounting for just under 20 percent of GDP and 50 percent
of employment, although its share in GDP has decreased steadily
(from over 30 percent of GDP in 1996). Industry contributes
about 14 percent of GDP and 6 percent of employment, with its share
changing little. The share of transport and
telecommunications has nearly tripled from 4.6 percent in
1996 to 12.1 percent by 2002. Transport has been the fastest growing
sector, growing at over 20 percent annually because of the rapid
expansion of oil transit from the Caspian Sea. Although transport
turnover has tripled, it is still at one third of the
pre-independence level. Other fast growing sectors include
construction and financial services. Trade has grown slightly
faster than overall GDP. Sectoral growth index is presented in Fig.
3.1.1.
According to information from 2001 88.6% of the economically active population was employed, thus the unemployment rate was 11.4%.
The distribution of the employed work force by economic sectors is as follows:
|
Sector |
% |
|
Agriculture & forestry, fishery |
53,4 |
|
Mining Industry |
0,3 |
|
Processing Industry |
6,5 |
|
Energy, gas or water production and supply |
1,2 |
|
Construction |
1,6 |
|
Trade & household goods technical service |
8,6 |
|
Hotels & Restaurants |
0,9 |
|
Transport, Warehouse economy and communications |
4,0 |
|
Financial mediation |
0,7 |
|
Operations with real estate, lease (rent) and business activity, research and projecting works |
2,1 |
|
State management and self-defense, compulsory social insurance |
5,8 |
|
Education |
7,4 |
|
Health care and social service |
4,3 |
|
Other communal, social and personal service, culture, entertainment, rest |
2,4 |
|
Hired (engaged) service in private domestic economy |
0,4 |
|
Ex-territorial (International) organization |
0,1 |
|
Unidentified |
0,1 |
|
Total |
100 |
According to 2001 data, the minimum subsistence level for a medium sized family (4 persons) at average prices was 205.2 GEL.
Agriculture
Introduction. Only 44 percent of Georgia’s land is used for agriculture. Twenty-six percent is arable land, 9 percent is used for perennials, 65 percent is pastureland, and 0.4 percent is fellow land. Sixty percent of the arable land needs artificial irrigation. The soil is mainly moderately fertile and easy to cultivate. Table 1 below shows the distribution of the agricultural land by agricultural product.
Table 1 Distribution of Agricultural Land by Product
|
Product |
Land occupied (thousand ha) |
|
Cereals |
379,0 |
|
Citrus |
10,9 |
|
Fruit |
60,0 |
|
Potato |
34,0 |
|
Sunflower |
40,0 |
|
Tea |
40,0 |
|
Vegetables |
40,0 |
|
Vineyards |
61,3 |
In the 20th century, Georgia became a country of agro-industry, with well-developed agriculture and food industry and with a good level of production. More than half of its GDP came under the agro-industrial sector of the country; 47 - 48% of the main funds were accumulated within the sector and it employed 41 - 42% of the total population of Georgia.
Georgia used to be an important exporter of food and one of the main suppliers of vegetables, tea, citrus fruits, wine, mineral waters, brandy, canned and fresh vegetables and fruits to the markets of the former Soviet Union. In the second half of the 1980s, the Georgian share of the food market of the former Soviet Republics was 10 percent. The total amount of exported food products was 1.7 times more than imported ones. The country is now undertaking actions to re-establish this exporting.
Since independence in 1991 the country experienced many years of civil war and ethnic conflicts, with 260,000 people internally displaced.
However, Georgia's economy is still strongly linked to the Russian Federation and the Commonwealth of Independent States (CIS). Approximately 50 percent of its trade is with the CIS.
Agriculture is a main source of income and employment for the majority of the population, accounting for more then 30 percent of GDP. Output in the sector is only about 40 percent of its 1990 level, but employment in the sector has doubled and it now accounts for over 50 percent of the total employment.
Land privatisation has focused on the small-scale (household/subsistence) sector with little real progress in restructuring the former large state farms. Land reform has resulted in the allotment of small parcels of land up to 1.25 hectares to each rural family and the lease, through district authorities, of state owned land to persons or legal entities, with the aim of creating a subsistence sector for small farmers and a market sector controlled by large leaseholders.
Private producers account for the significant share of fruit, vegetable and livestock production, when their share in wheat production is about two thirds of the total wheat production in the country. The bulk of the domestic wheat production is consumed on farms for food, seed or feed. Indications are that only 20 percent of domestic production of wheat is marketed.
Low yields, also as a result of poor infrastructure, inadequate access to credit for inputs and suitable machinery, and high costs associated with transport and marketing have had a negative impact on food production and the earning capacity of a significant proportion of the population and thus on household food security.
The state of irrigation and drainage systems is also a major constraint to increasing crop yields and the competitiveness of domestic produce with imports. More than 60 percent of grain, 60 percent of dairy products and 33 percent of meat consumed in the country are imported.
Agricultural production in Georgia dropped sharply in 2000 due to a serious drought. WFP/FAO Crop and Food Supply Assessment mission carried out in mid-August 2000 estimates that Georgia will face a severe food crisis due to the drought. This situation is being exacerbated by on-going serious economic problems.
After droughts, agricultural production showed a slight increase of 5.6 percent in 2001, however the share of agricultural output in GDP dropped from 21 percent in 2000 to 19.2 percent in 2001.
During the present year, USAID has launched a five year program, called Support Value Added Enterprise (SAVE) that will promote economic growth through expanded production and sales of added-value agricultural products on international markets. Through this program the US government will support agriculture development through market expansion, standards on organic food production, distribution, improved credit and whole-chain food distribution networks.
Key Agriculture Indicators.
Agricultural output per hectare of agricultural land and per capita (US $)
|
Year |
Per 1 ha of agricultural land |
Per capita |
|
1990 |
1195 |
725 |
|
1995 |
481 |
272 |
|
1996 |
539 |
302 |
|
1997 |
583 |
328 |
|
1998 |
531 |
301 |
|
1999 |
435 |
285 |
Source: Georgian Agriculture 1999
Agriculture in GDP
|
1990 |
1991 |
1992 |
1993 |
1994 |
1995 |
1996 |
1997 |
1998 |
1999 |
2000 |
2001 |
|
29,7 |
41,7 |
31,0 |
28,2 |
24,8 |
25,0 |
21,5 |
19,2 |
||||
|
31,9 |
28,8 |
55,5 |
70,4 |
34,2 |
39,5 |
32,6 |
Source: State Department for Statistics of Georgia (1st Row), GEPLAC , 1997(2nd Row).
Trends in Share of Total Agricultural Production, (%)
|
1985 |
1990 |
1995 |
1996 |
1997 |
1998 |
1999 |
2000 |
|
|
Crop production |
68.1 |
68.7 |
58.4 |
49.8 |
59.3 |
56.4 |
56.8 |
45,8 |
|
Livestock Production |
31.9 |
31.3 |
41.6 |
50.2 |
40.7 |
43.6 |
43.2 |
54,2 |
Source: SDS, Georgian Agriculture 2000, p.9.
Agricultural output (Current prices, mln. lari)
|
Agricultural Production |
1980 |
1985 |
1990 |
1995 |
1996 |
1997 |
1998 |
1999 |
2000 |
2001 |
|
Total production |
3219 |
4167 |
5199 |
1851 |
2062 |
2299 |
2266 |
2650 |
2024 |
1860 |
|
Of which: Plant-growing |
2240 |
2838 |
3571 |
1081 |
1027 |
1363 |
1278 |
1506 |
927 |
|
|
Livestock |
979 |
1329 |
1627 |
770 |
835 |
936 |
988 |
1144 |
1097 |
|
|
Of which by households |
1584 |
2087 |
2495 |
1407 |
1650 |
1863 |
2116 |
2490 |
1903 |
|
|
Of which: Plant-growing |
1102 |
1421 |
1714 |
816 |
805 |
1150 |
1163 |
1386 |
870 |
|
|
Livestock |
481 |
666 |
781 |
591 |
845 |
713 |
953 |
1105 |
1033 |
Source: Georgian